
Run With Me
A Beginner-First iOS Running App · iOS · Product Case Study
📌 TL;DR
- Problem: Beginners quit running because existing apps make them feel inadequate (pace, leaderboards, complex stats).
- Hypothesis: Replacing pace-based feedback with effort-based feedback will increase perceived competence and retention.
- Target: ≥18% Week 4 retention vs industry average ~3% (Curry, 2026).
- Key pillars: Effort Over Pace · Free Micro-Education · Private Community.
- What I learned: Run a larger survey (n=9 is directional); prototype effort rating before coding; move weekly goal to “Should Have” under scope pressure.
🔑 The One-Sentence Hypothesis
If we replace pace-based feedback with effort-based feedback, beginner runners will feel more competent after each run — evidenced by 18% Week 4 retention vs. ~3% industry average.
Executive Summary
Run With Me is a beginner-first iOS running app built around a single insight: beginners don't quit because running is hard — they quit because existing apps make them feel inadequate.
The MVP tests one core idea across three measurable outcomes:
| Outcome | Target | Benchmark |
|---|---|---|
| Post-run satisfaction score | ≥ 4.2 / 5 | — |
| Week 4 retention | ≥ 18% | ~3% industry average (Curry, 2026 – Health and Fitness App Benchmarks) |
| Effort rating adoption | ≥ 70% of runs | — |
This case study documents the full process: user research → competitive analysis → persona definition → MoSCoW prioritisation → user stories → journey mapping → roadmapping — and reflects honestly on what I would do differently.
Problem and Opportunity
The Market
The global fitness app market was valued at $12.1 billion in 2024, projected to reach $25.8 billion by 2030 (CAGR 13.5% from 2024 to 2030) (ResearchAndMarkets/Business Wire, 2025). Fitness apps were downloaded 858 million times in 2023 alone (Curry, 2026).
Despite this scale, the market is dominated by platforms built for intermediate-to-advanced users. No major app has staked a clear, beginner-first position centred on effort-based feedback rather than pace.
Target Demographic
Based on our directional survey (n=9), target users are young adults (18–34) and overwhelmingly beginners (75%). They find existing apps intimidating and want encouragement, not competition. Specifically: 44% of respondents were aged 18–24 and 44% aged 25–34; 75% identified as either “thinking about starting” or a “beginner.” Psychographically, these users are intimidated by complex data, disengaged by public performance metrics, and motivated by personal progress and positive reinforcement over competitive comparison.
Why Beginners Quit
- ~30% of novice runners stop within 26 weeks; the leading cause is running-related injury (Kluitenberg et al., 2018)
- ~50% of people who begin an exercise programme drop out within six months (Biddle and Mutrie, 2008)
- Runners who quit lacked autonomous motivation; often lacked a meaningful reason for running and struggled with internal doubts about their ability to continue (McCormick et al., 2024)
The Gap
Existing apps (Strava, Nike Run Club, Adidas Running) are built around pace, public leaderboards, and brand communities. They solve the wrong problem for beginners.
The gap: a calm, encouraging, effort-first companion that treats “How did it feel?” as a more important question than “How fast did you go?”
Why Now?
Three forces are converging. First, the market is growing fast (13.5% CAGR) but the dominant players are moving upmarket, widening the gap for beginners. Second, beginner dropout rates remain high and largely unaddressed. Third, the rise of “soft fitness” – low-pressure, enjoyable movement – signals growing appetite for effort-over-pace.
User Research
Methodology
| Method | Details | Output |
|---|---|---|
| Online Survey | n=9; Google Forms; September 2025 | Quantitative trends on demographics, pain points, motivation |
| Semi-structured Interviews | 3 × 25-min interviews | Emotional journey, specific frustrations, unmet needs |
| Secondary Research | 5 peer-reviewed studies + industry benchmarks | Statistical triangulation |
| Competitive Analysis | Strava, Nike Run Club, Adidas Running | Strategic gap identification |
⚠️ Honest limitation: The survey sample (n=9) is directional, not statistically significant. All findings were triangulated with peer-reviewed secondary research. A larger quantitative study (n=100+) is the recommended next step before V1 investment.
Key Survey Findings
| Metric | Result | Product Implication |
|---|---|---|
| Age range | 44% aged 18–24; 44% aged 25–34 | Confirms young-adult target demographic |
| Running level | 75% “thinking about starting” or “beginner” | Validates core user segment |
| Post-run feelings | 62.5% feel proud; 37.5% feel motivated | Reinforce positive emotions in post-run loop |
| Feedback preference | 75% prefer a mix of stats and encouragement | Supports effort-first + data-secondary design |
| Social sharing | 62.5% find sharing fun; 25% say “not for me” | Social features must be optional and private |
Three Key Quotes
User Personas
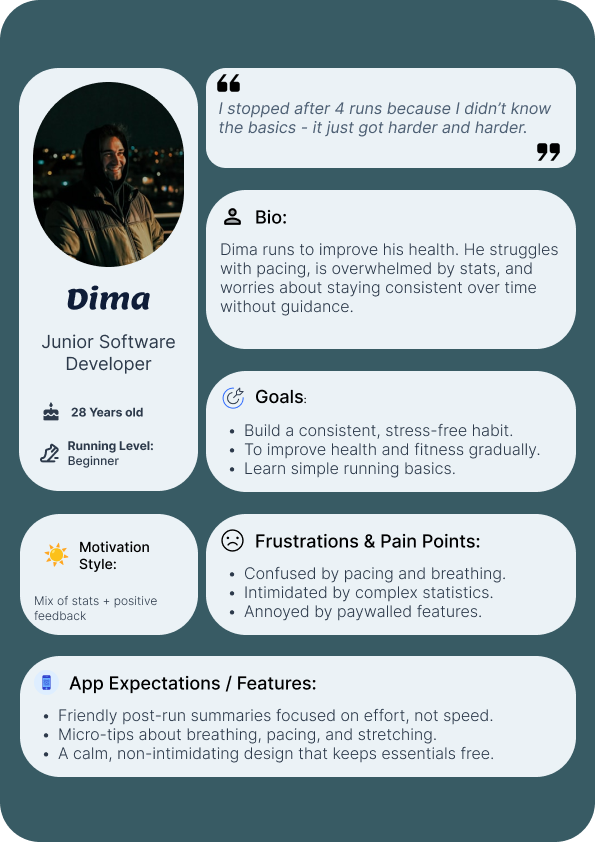
Dima · Primary Persona
28 · Junior Developer · Beginner Runner
Dima runs to improve his health. He struggles with pacing, is overwhelmed by stats, and worries about staying consistent without guidance.
- Goals: Build a stress-free habit; learn fundamentals; track effort-based progress
- Frustrations: Complex stats; no pacing/breathing guidance; paywalled basics
- Needs from the app: Friendly post-run summaries focused on effort; micro-tips on breathing and pacing; calm, non-intimidating design
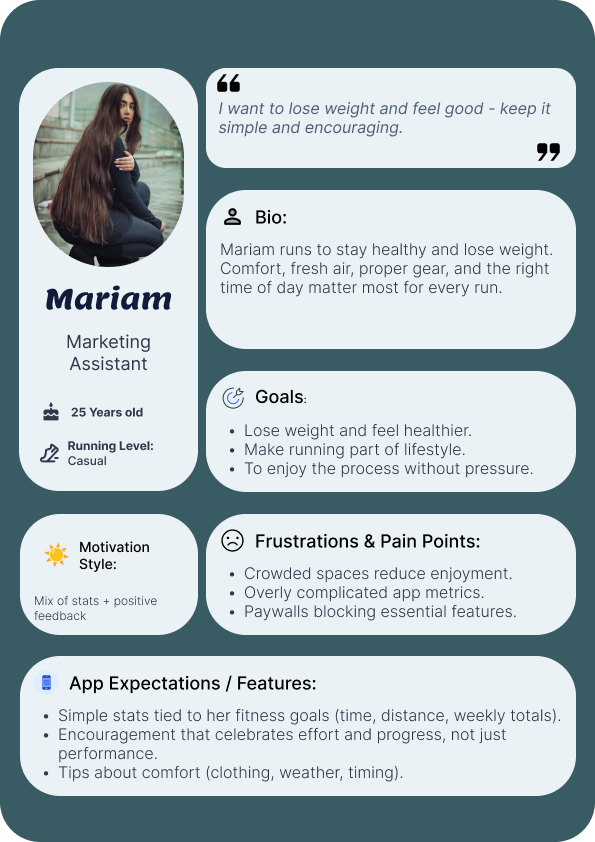
Mariam · Secondary Persona
25 · Marketing Assistant · Casual Runner
Mariam runs to stay healthy and lose weight. Comfort and the right environment matter as much as the run itself.
- Goals: Lose weight; make running part of lifestyle; enjoy the process without pressure
- Frustrations: Overly complicated metrics; paywalls blocking essential features
- Needs from the app: Simple stats tied to fitness goals; encouragement that celebrates effort; tips about comfort (clothing, weather, timing)
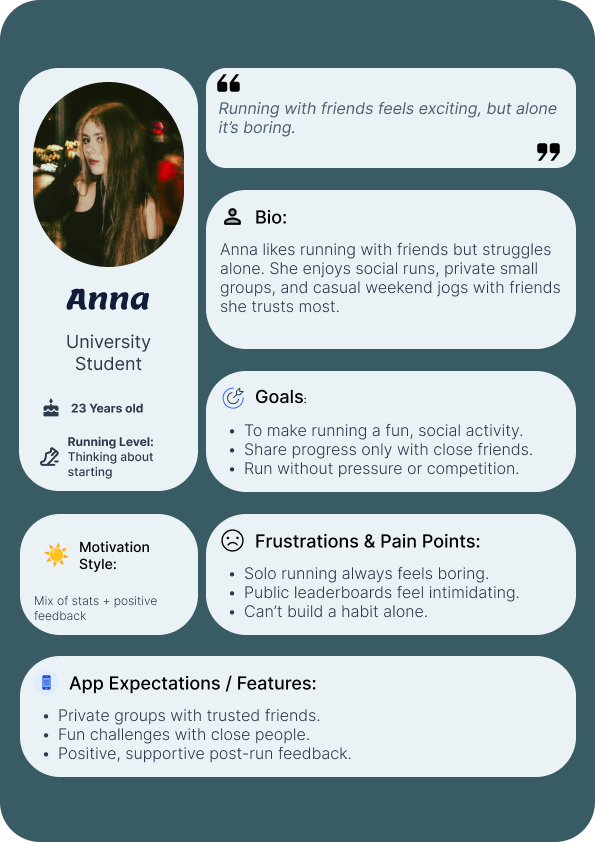
Anna · Secondary Persona
23 · University Student · Thinking About Starting
Anna thrives running with friends but can’t build a solo habit. Public leaderboards feel intimidating and competitive.
- Goals: Make running a fun social activity; share progress only with close friends; run without pressure
- Frustrations: Solo running is boring; public leaderboards are intimidating; can’t build a habit alone
- Needs from the app: Private groups with trusted friends; fun challenges; positive, supportive post-run feedback
Competitive Analysis
| Dimension | Strava | Nike Run Club | Adidas Running | Run With Me |
|---|---|---|---|---|
| Core philosophy | Social network for serious athletes | Gamified personal journey | Building a global movement | The encouraging beginner's companion |
| Post-run feedback | Data-heavy: pace, segments, leaderboard | Celebratory but pace-focused | Social-sharing focus; comprehensive stats | Effort-first (Tough / Good / Great) + free micro-tip |
| Social model | Public and competitive; leaderboards | Brand-led community challenges | Group challenges and clubs | Private, opt-in only; no public leaderboards |
| Beginner education | Largely paywalled | Free audio-guided runs | Mix of free and premium | Free contextual micro-tips after every run, always |
| Key weakness for our user | Beginners feel inadequate | Brand-centric; less personal | Interface can feel cluttered | — |
Strategic Positioning
Run With Me is the only major running app that:
- Treats effort perception as the primary success metric
- Keeps foundational education free
- Makes social features genuinely private
The three strategic pillars — Effort Over Pace, Free Micro-Education, Private Community — are commitments, not features. They define what this product promises not to do as much as what it does: no public leaderboards, no paywalled basics, no mandatory social performance.
Product Strategy
Vision
To become the most trusted and encouraging starting point for every new runner’s journey.
The Problem We Solve
Beginner runners need a simple and encouraging way to start and track their runs, because they are often discouraged by overly complex data, intimidating comparisons to advanced athletes, and a lack of motivation — which causes them to quit early.
Core Hypothesis
We believe that by providing post-run feedback focused on effort rather than pace, and offering short educational micro-tips, we will increase motivation and reduce the quit rate for new runners.
Three Strategic Pillars
Pillar 1 · Effort Over Pace
The primary post-run metric is a user-rated effort score (3 options: Tough / Good / Great, mapped internally to 1–5). Self-Determination Theory research shows that autonomous motivation — feeling competent and in control — is a strong predictor of long-term exercise adherence (Teixeira et al., 2012).
Pillar 2 · Free Micro-Education
Every run ends with one free contextual tip (breathing, pacing, stretching). This directly solves the most-stated reason for quitting: “I didn’t know the basics.” Educational content is never paywalled.
Pillar 3 · Private Community
Social features are opt-in and private-group only. No public leaderboards. This provides the social support users want while removing the competitive pressure that drives beginners away.
OKRs and Feature → KPI Mapping
OKRs — MVP Validation Phase
| Objective | Key Result | Linked Feature |
|---|---|---|
| O1: Validate effort-based feedback increases motivation | KR1: 4.2/5 post-run satisfaction | Post-Run Celebration + Effort Rating |
| KR2: 18% Week 4 retention | Full feedback loop (Celebration → Rating → Tip) | |
| KR3: 70% effort rating adoption per run | Effort Rating UX (RW-005) | |
| O2: Establish core engagement | KR1: 3+ runs/week for active users | Run Tracking + Weekly Goal Ring |
| KR2: 40% goal completion rate | Adaptive Weekly Goal |
📊 Instrumentation: All metrics tracked via Mixpanel. Events: run_started, run_completed, effort_rated (with value), tip_shown, goal_set.
Product Flywheel
The Run With Me growth loop works like this:
Each run deposits into a competence account: the runner knows more, feels better, and sees evidence of progress — creating an intrinsic motivation loop that competitors’ pace-first models cannot match for this segment.
MVP Scope and MoSCoW Prioritisation
MVP Goal
To validate the core hypothesis using the smallest possible set of features testable with real users.
| Priority | Feature | Description | KPI Link |
|---|---|---|---|
| ✅ Must Have | Onboarding | Sign up in <60 seconds; set level and weekly goal; no payment | Enables all other features |
| ✅ Must Have | Post-Run Celebration + Effort Rating | Celebratory message → Tough / Good / Great → micro-tip | KR1, KR3 |
| ✅ Must Have | Simplified Solo Run Tracking | Start in ≤2 taps; tracks time, distance, pace | Core utility |
| ✅ Must Have | Run History with Context | Calendar view: distance, effort rating, tip, weekly trends | KR2 |
| ✅ Must Have | Adaptive Weekly Goal | Visual goal ring + progress stats | KR2 (O2) |
| 🟡 Should Have | Async Run Buddy (1:1) | Invite one friend; high-five reactions; no live tracking | Social validation |
| 🟡 Should Have | Achievement Badges | Badges for consistency, effort, milestones | Engagement depth |
| 🔵 Could Have | Expanded Tip Library | More tips mapped to effort + distance combos | Enhances core value |
| 🔵 Could Have | Private Groups (2–5 friends) | Invite-only group feed; optional shared goals; emoji reactions | Only after Buddy validates |
| ❌ Won’t Have | Public Leaderboards | Any public comparison | Confirmed pain point |
| ❌ Won’t Have | Advanced Analytics | Splits, heart rate zones, VO₂ max | Intimidates beginners |
| ❌ Won’t Have | Live Group Running | Real-time location sharing | Creates performance anxiety |
| ❌ Won’t Have | Paywalls on Core Features | Locking encouragement or education | Contradicts trust-building goal |
📝 Note on Weekly Goal: Maintained as Must Have for OKR 2. Under genuine scope pressure, it would be the first Must Have deprioritised — it does not directly test the core hypothesis.
Key User Stories and Acceptance Criteria
Three stories form the core of the hypothesis test. The full backlog (RW-001 to RW-016) is in the accompanying spreadsheet.
RW-004 · Post-Run Celebration
Persona: Anna
Story: As a social beginner, I want to see a celebratory message immediately after finishing my run, so I feel accomplished regardless of my pace.
Priority: Must Have
Acceptance Criteria:
- Celebration screen appears automatically after run is stopped and saved
- Message is personalised: “Great job, [Name]! You ran [X] minutes!”
- Confetti animation plays on screen
- User taps “Continue” to proceed to effort rating
- Screen shows option to share to private feed (only if buddy connection exists)
RW-005 · Effort Rating
Persona: Dima
Story: As a beginner, I want to quickly indicate how my run felt, so the app can give me relevant encouragement and track my perceived effort.
Priority: Must Have
Acceptance Criteria:
- After celebration screen, user sees: “How did that feel?”
- Three large, equal-size buttons: Tough / Good / Great
- One tap selects and saves the rating; linked to the run in history
- If dismissed, app defaults to “Good” after 10 seconds (neutral, non-judgmental default; prevents drop-off)
- Rating visible in run history alongside distance and tip received
🔬 Research grounding: The 3-option scale (mapped internally to 1–5) is grounded in Borg’s (1982) Ratings of Perceived Exertion framework, adapted for simplicity.
RW-006 · Contextual Micro-Tip
Persona: Dima
Story: As a learner, I want to receive one short, actionable tip based on my run, so I can improve next time.
Priority: Must Have
Acceptance Criteria:
- After effort rating, one tip is displayed based on:
- Tough + duration >20 min → “Try slowing your first 5 minutes to save energy.”
- Good + consistent pace → “Your steady pace builds endurance!”
- Great → “You’re progressing — try adding 2 minutes next time.”
- Default fallback → “Drink water and stretch!”
- User can save the tip to run history
- Tip is never repeated on consecutive runs (rotation logic applies)
User Journey Map
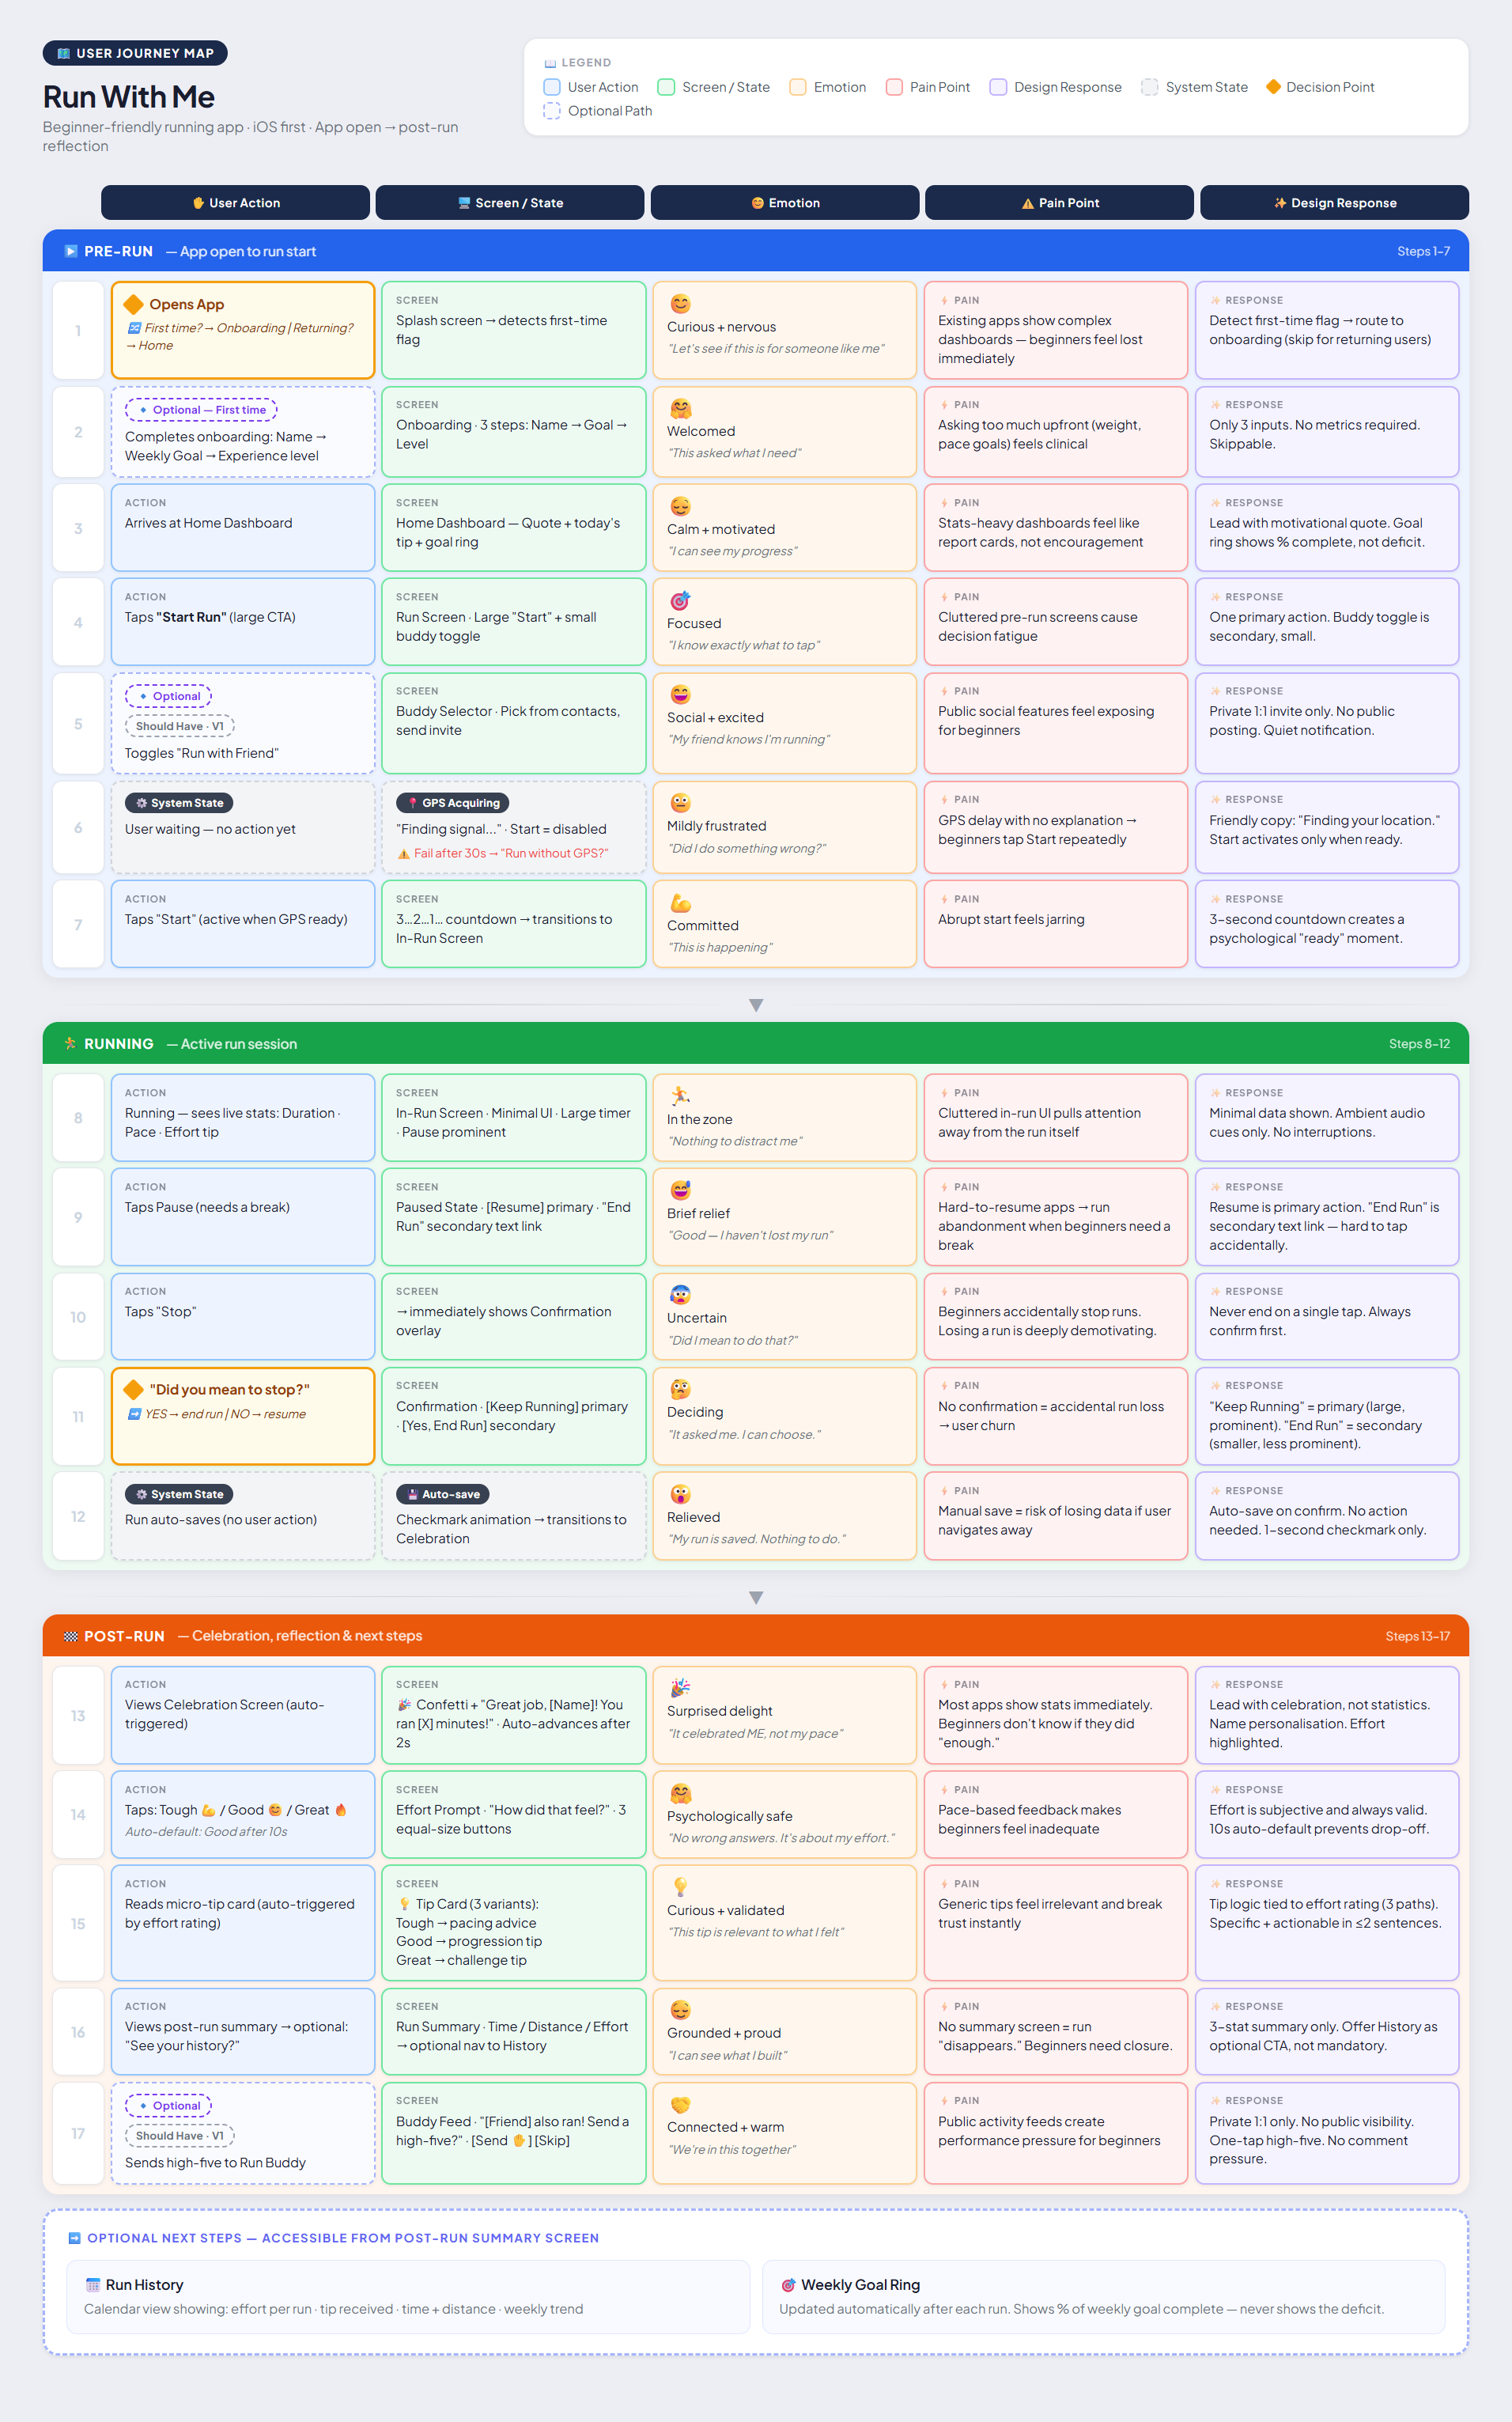
Journey map image – view description below
Journey map (tap to enlarge)
The map documents all 17 touchpoints, with design responses mapped against each pain point. The post-run phase (Steps 13–17) is the critical hypothesis test — all three core features converge here.
Phase 1 · Pre-Run (Steps 1–7)
Dima opens the app for the first time, feeling curious but slightly nervous (“Is this app for someone like me?”). He completes clean three-step onboarding — name, goal, running level — and arrives at the home dashboard with a motivational quote and goal ring.
Key pain points: GPS delay and decision fatigue from cluttered pre-run screens. Design response: Friendly GPS copy (“Finding your location…”); single primary CTA; 3-second countdown creates a psychological “ready” moment.
Phase 2 · Running (Steps 8–12)
Minimal in-run screen: large timer, distance, pace. Nothing else. He’s protected from accidental run loss by a mandatory “Did you mean to stop?” confirmation. Auto-save on confirmation means no data is ever lost.
Emotional peak: “In the zone — nothing to distract me.”
Phase 3 · Post-Run (Steps 13–17)
Celebration screen triggers automatically. Dima sees his name, his time, and confetti. He rates his effort, receives a contextual micro-tip, and views a 3-stat summary. Optionally: a buddy also ran, one-tap high-five.
Emotional arc end: “Grounded and proud — I can see what I built.”
Product Roadmap
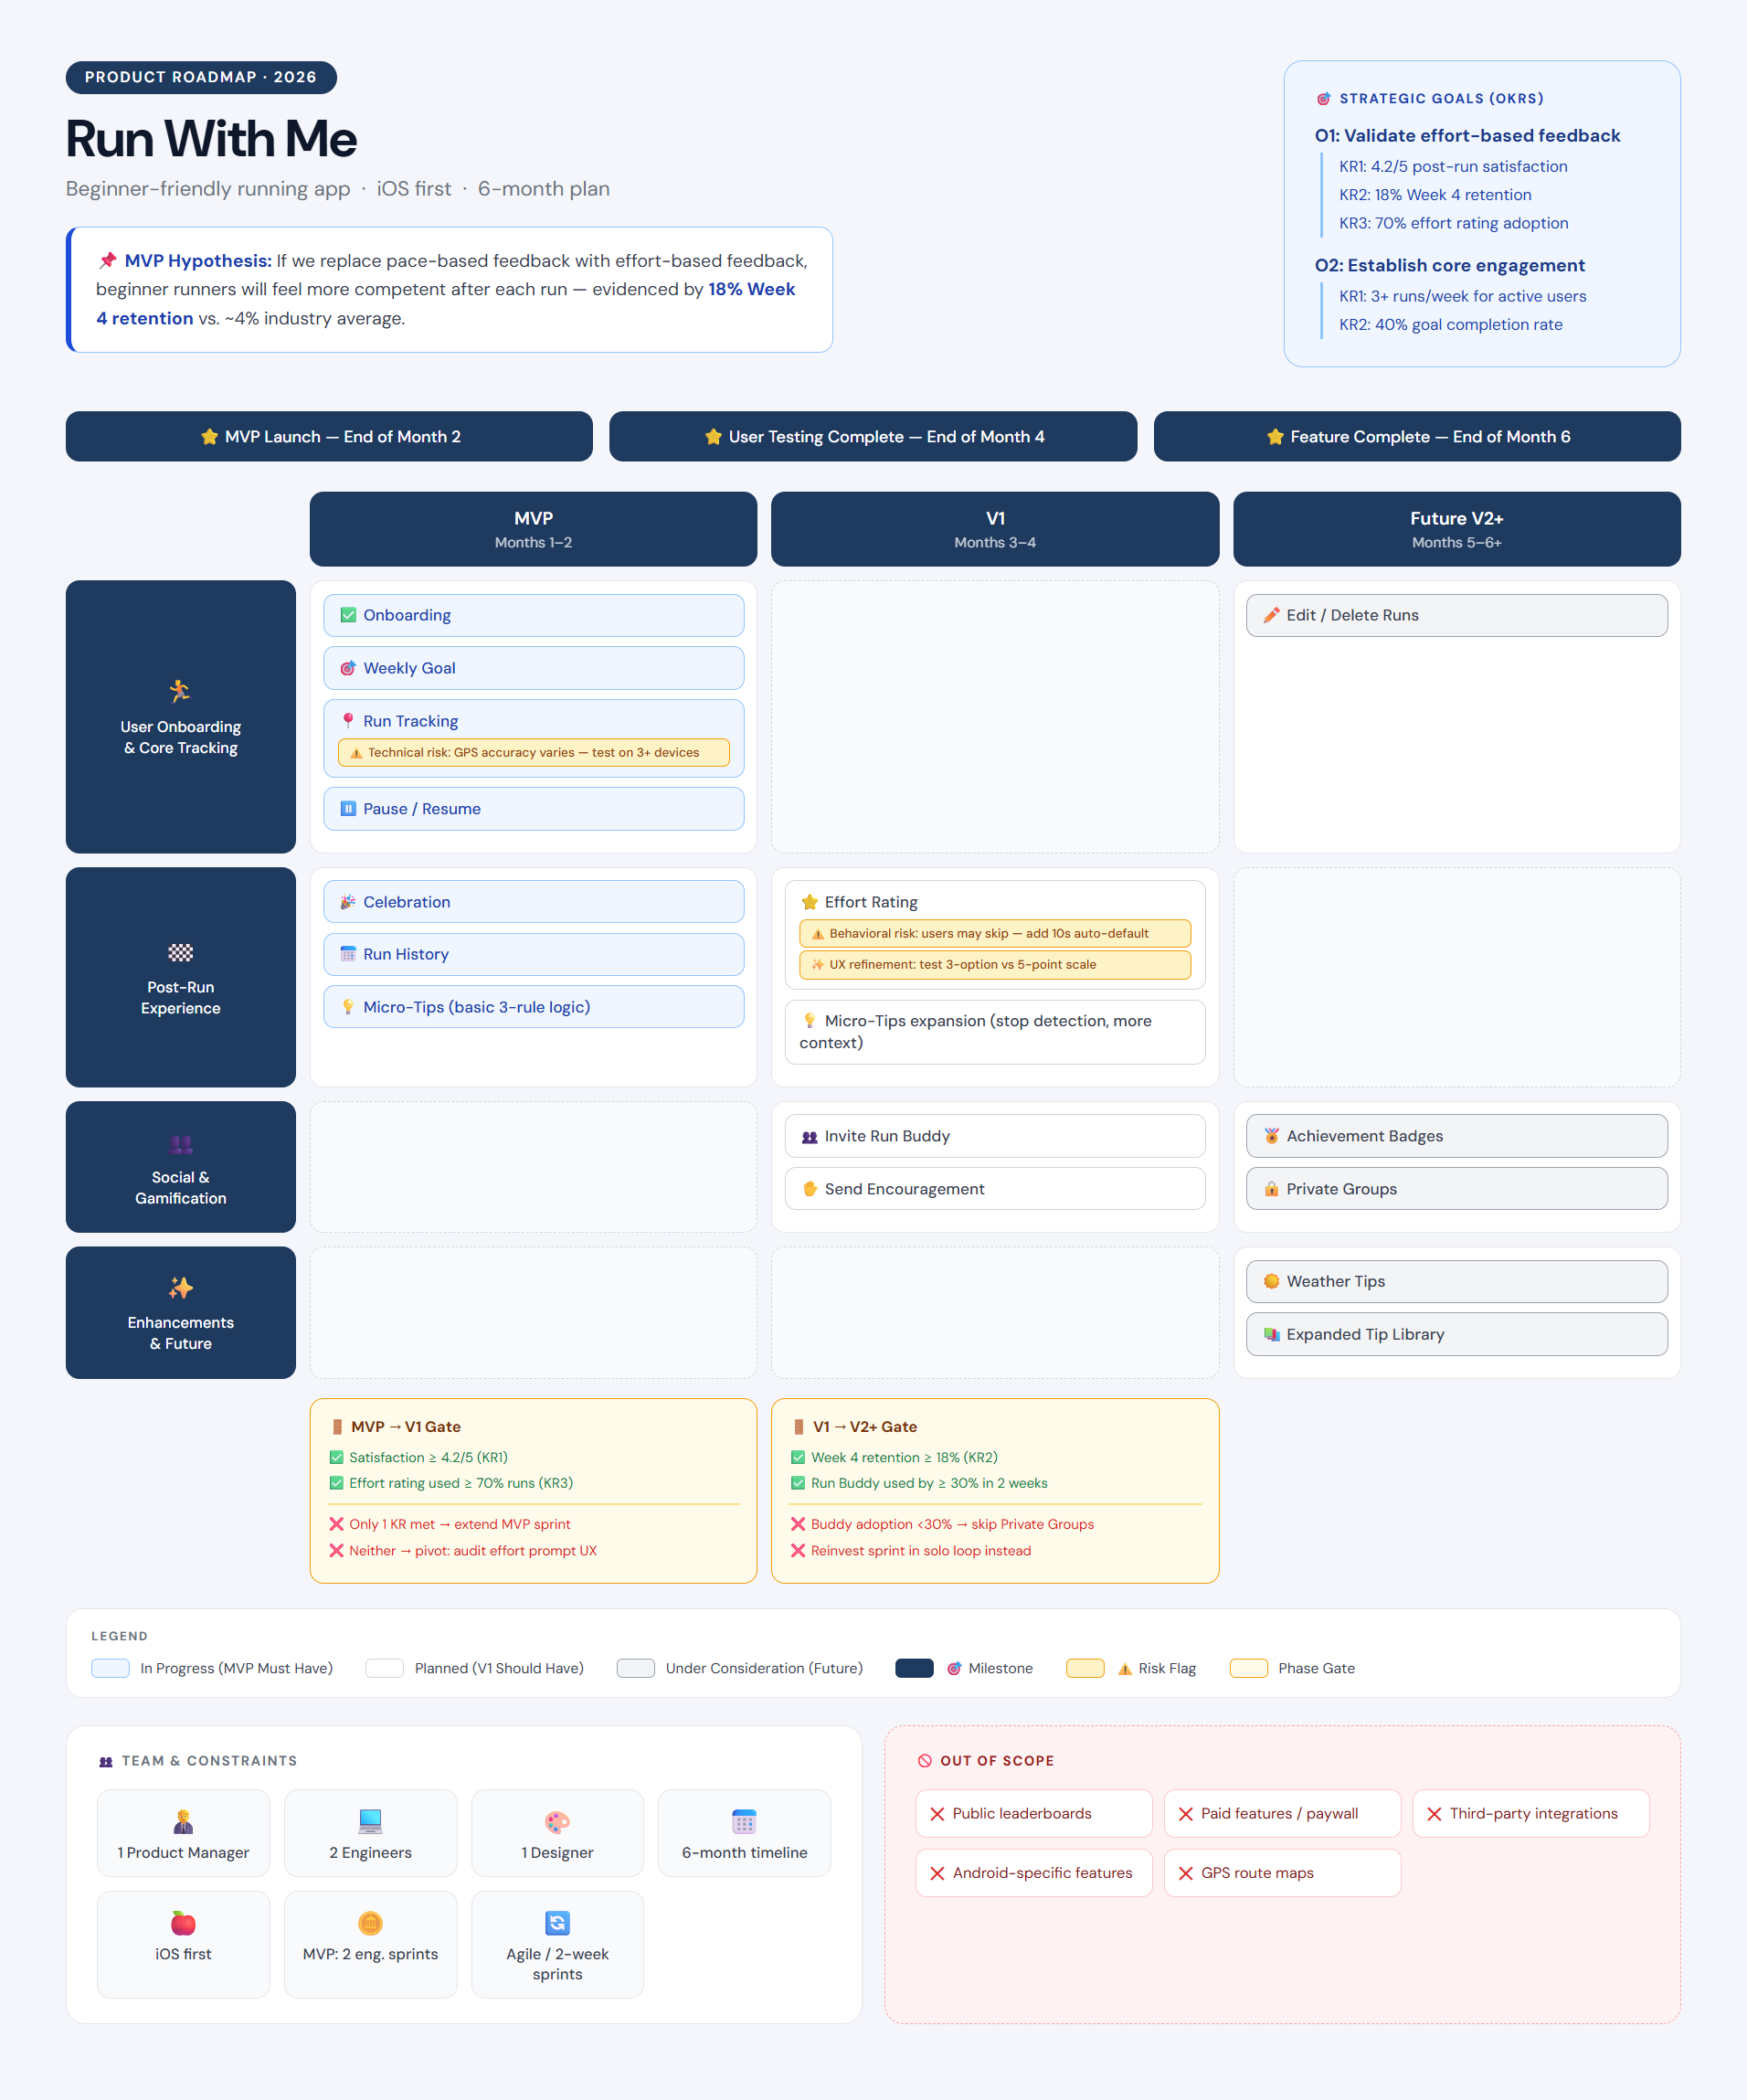
6-month roadmap (tap to enlarge)
Phased Plan
| Phase | Timeframe | Theme | Key Deliverables |
|---|---|---|---|
| MVP | Months 1–2 | Validate the hypothesis | Onboarding, Run Tracking, Post-Run Celebration, Effort Rating, Micro-Tips, Run History, Weekly Goal |
| V1 | Months 3–4 | Deepen engagement | Effort Rating UX refinement, Micro-Tips expansion, Invite Run Buddy, Send Encouragement |
| V2+ | Months 5–6 | Build community | Achievement Badges, Private Groups, Weather Tips, Expanded Tip Library, Edit/Delete Runs |
Phase Gates
MVP → V1 Gate (End of Month 2)
Both of the following must be met to proceed:
- Post-run satisfaction ≥ 4.2/5 (KR1) ✓
- Effort rating used in ≥ 70% of runs (KR3) ✓
If only one KR met: Pivot — audit effort rating prompt UX before building new features.
If neither met: Halt. Reinvest the sprint in the solo feedback loop before any social or gamification work.
V1 → V2+ Gate (End of Month 4)
Both of the following must be met:
- Week 4 retention ≥ 18% (KR2) ✓
- Run Buddy adopted by ≥ 30% of active users within first 2 weeks ✓
If buddy adoption <30%: Skip Private Groups; reinvest sprint in the solo run loop instead.
Team and Constraints
| Role | Count | Notes |
|---|---|---|
| Product Manager | 1 | |
| Engineers | 2 | |
| Designer | 1 | |
| Timeline | 6 months | Agile / 2-week sprints |
| Platform | iOS first | MVP: 2 eng. sprints |
Out of Scope
Public leaderboards · Paid features / paywall · Third-party integrations · Android-specific features · GPS route maps
Validation Strategy
⚠️ This section describes what I would do — these are proposed experiments, not executed ones.
Experiment 1 · Effort Rating Format (Week 1, Pre-Build)
Question: Does Tough / Good / Great outperform a 5-point scale for comprehension and completion rate?
Method: Low-fidelity prototype test with 8–10 beginner runners
Success signal: ≥80% complete the rating without confusion; qualitative preference for 3-option
Experiment 2 · Post-Run Screen Order (Week 3–4, MVP Sprint)
Question: Does leading with the celebration message before the stats improve satisfaction scores?
Method: A/B test — Celebration-first vs. Stats-first; measure satisfaction prompt score
Success signal: Celebration-first achieves ≥4.2/5 vs. <4.0/5 for Stats-first
Experiment 3 · 10-Second Auto-Default (Week 5–6, MVP Sprint)
Question: Does the 10-second default to “Good” preserve data quality or introduce signal noise?
Method: Cohort analysis — compare effort distribution for users who rated manually vs. those who defaulted
Success signal: Auto-default group shows <15% rate difference from manual group, and ≥60% effort rating completion
Experiment 4 · Week 2 Retention as Leading Indicator (Post-Launch)
Question: Is Week 2 retention a reliable early signal for Week 4 retention?
Method: Track cohort correlation between W2 and W4 across first three user cohorts
Success signal: r ≥ 0.7 correlation; if yes, use W2 as go/no-go signal for faster iteration
What I Learned and Open Questions
What I Learned
- Run a larger survey (n=100+) before committing to V1 build. The n=9 survey was valuable for hypothesis generation and directional patterns — not for statistically confident decisions. Cross-referencing with four peer-reviewed studies gave findings structural credibility, but the honest limitation remains. A larger quantitative sample is needed before significant V1 engineering investment.
- Move Weekly Goal to Should Have. The weekly goal ring is a good product feature and supports OKR 2, but it does not directly test whether effort-based feedback increases motivation. That test lives entirely in the Effort Rating and Micro-Tip features. Under genuine scope pressure, Weekly Goal should be deprioritised.
- Prototype the effort rating UX before any engineering sprint. The 3-option design (Tough / Good / Great) is itself a hypothesis. Would a 5-point scale work better? An emoji slider? Would users understand “perceived effort” without explanation? This question should be answered with a low-fidelity prototype in Week 1 — not discovered in usability testing after build.
Open Questions
- Does the 10-second auto-default to “Good” reduce meaningful data quality, or does it protect against drop-off enough to justify the trade-off?
- At what point does a beginner runner “graduate” — and how does the product handle the transition without losing them to Strava?
- What prevents the micro-tip engine from feeling repetitive after 10–15 runs, and who maintains the tip library over time?
- Is Week 4 the right retention milestone, or should we instrument Week 2 as an earlier signal of whether the habit loop is forming?